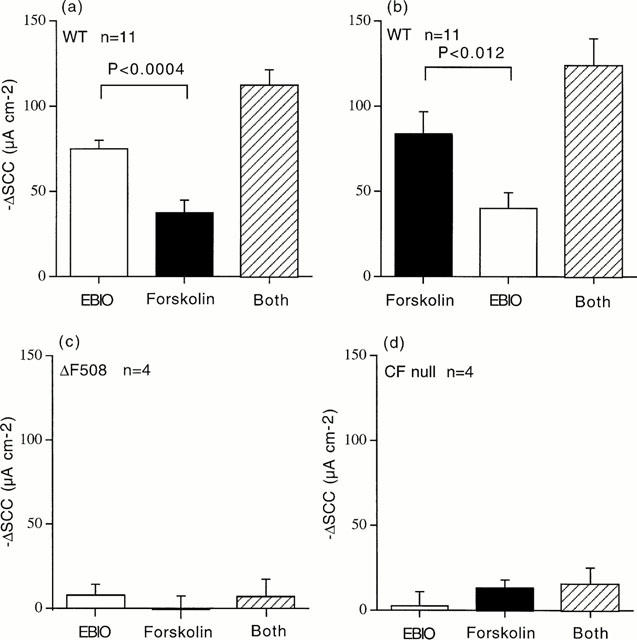
Figure 3.

Cumulative SCC responses in depolarized epithelia. In (a) responses are shown to EBIO (600 μM) followed forskolin (10 μM), whereas in (b) the order was reversed. The total responses to both agents was not different in (a) and (b). Data for 11 separate experiments are given in (a) and (b). In (c) and (d) data are shown for experiments comparable to those in (a) for colonic epithelia from CF ΔF508 mice (c) and CF null mice (d), n=4 for all CF tissues. Comparing the responses to EBIO in wild type colons (a) (75.0±6.3 μA cm−2), the responses in CFΔF508 (c) (7.9±6.3 μA cm−2) and CF null colons (d) (2.5±8.3 μA cm−2) were significantly smaller by P<0.02 and P<0.008 respectively.
