
Figure 3.
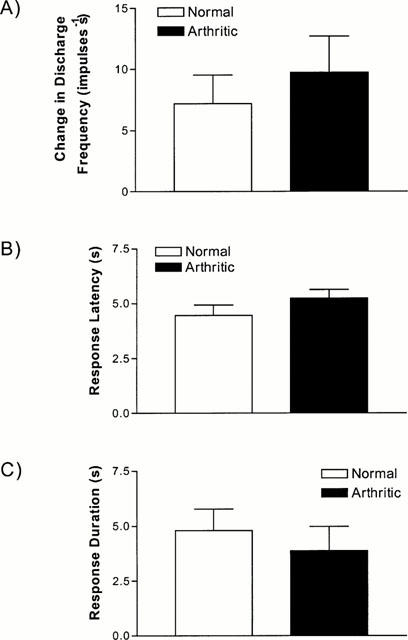
Comparison of the (A) increase in nociceptive discharge, (B) latency to onset, (C) duration of the response following a close arterial injection of anandamide (860 nmol). Data shown is for normal (15 units from five animals) and chronically arthritic (n=11 units from six animals) joints. There is no significant difference in any facet of the response between normal and arthritic joints (P>0.05, Mann – Whitney).