
Figure 3.
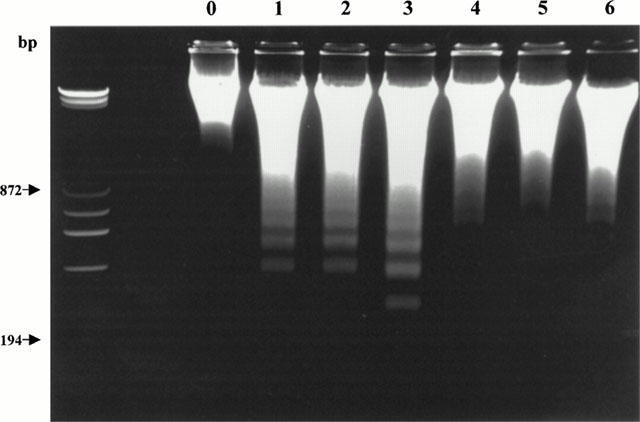
Representative photograph of electrophoretic analysis of internucleosomal DNA extracted from sham-operated control hearts (lane 0) or rabbit hearts exposed to I/R receiving either vehicle (lanes 1 – 3) or 3 μg kg−1 benidipine (lanes 4 – 6). The first lane is DNA cells size markers.