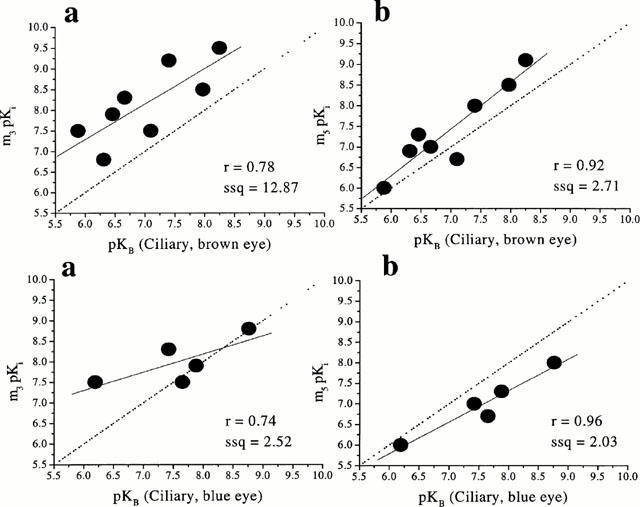
Figure 3.

Correlation between the functional affinities (pKB values) of muscarinic antagonists at muscarinic receptor(s) in dog ciliary muscle (brown and blue eyes; top and bottom respectively) and binding affinities (pKi values) at human recombinant muscarinic receptors (m3 and m5; a and b, respectively). The binding data were taken from Dörje et al., 1991; Eglen et al., 1997; Hegde et al., 1997; Nilvebrant et al., 1996). The broken line is the line of identity (x=y) while the solid line is the correlation plot (the inserts give the correlation factors (r) and the sum of squares values (ssq)).
