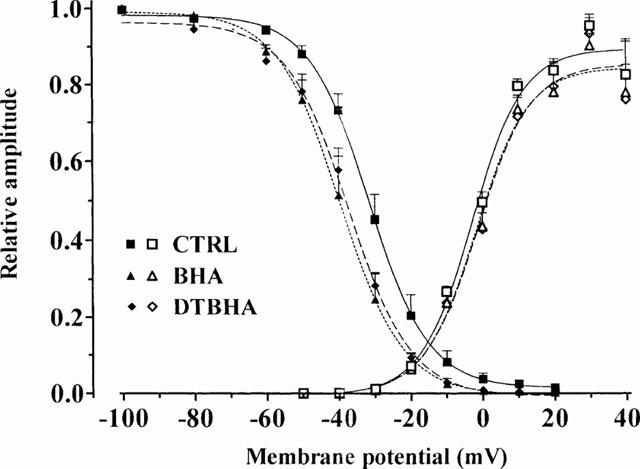
Figure 4.

Effect of BHA and DTBHA on activation and inactivation curves. Steady-state inactivation curves (closed symbols), obtained in the absence (CTRL) and presence of 50 μM BHA and 30 μM DTBHA, were fitted by the Boltzman equation. Peak current values were used. The steady-state inactivation curve was obtained using the double-pulse protocol (see Methods section). Amplitude of the current evoked by each test pulse was normalized to maximum ICa(L). Activation curves (open symbols) were obtained from the current-voltage relationships of Figure 2 and fitted to the Boltzmann equation (see Methods section). Relative amplitude is plotted against membrane potential. Each point represents the mean±s.e.mean of 4 – 10 cells.
