
Figure 2.
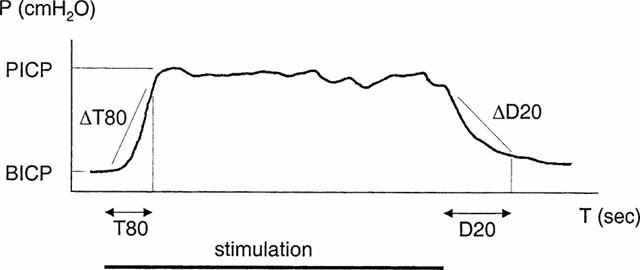
Typical curve showing the increase in intracavernous pressure (ICP) induced by nerve stimulation in vivo. During stimulation, the time for ICP to reach 80% of maximal increase (peak ICP – basal ICP) was recorded (T80). At this point, the increase per second (ΔT80) was evaluated. After stimulation, the time for and the rate by which a decrease to 20% of maximal pressure occurred (D20 and ΔD20) were determined.