
Figure 2.
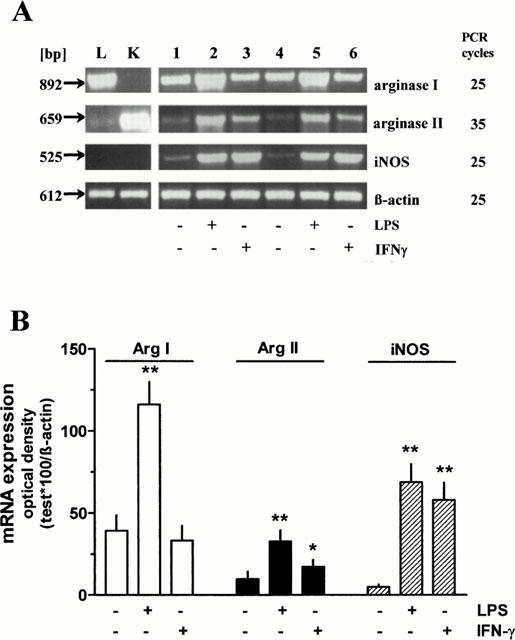
RT – PCR performed with RNA isolated from independent pools of rat AMΦ cultured for 20 h in the absence or presence of LPS (1 μg ml−1) or IFN-γ (500 u ml−1) (lanes 1 – 6) or from rat liver (L) and kidney (K) tissue using primer pairs specific for rat arginase I and II, iNOS and β-actin. PCR products were separated on a 1.2% agarose gel. (A) representative samples of PCRs. (B) densitometric quantification of the PCR bands. Given are the ratios of PCR products of arginase I and II, and iNOS×100 over the respective value of β-actin, mean values+s.e.mean of n=6 – 7. *P<0.05; **P<0.01 compared with the respective control value (absence of LPS and IFN-γ).