
Figure 3.
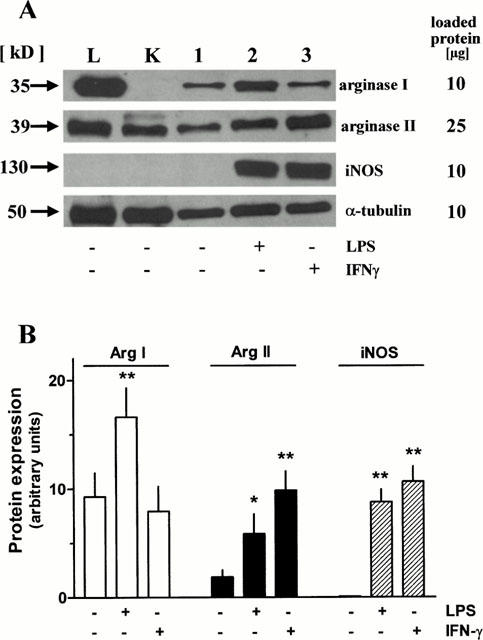
Immunoblot analysis of homogenates from rat AMΦ cultured for 20 h in the absence or presence of LPS (1 μg ml−1) or IFN-γ (500 u ml−1) (lanes 1 – 3) or from rat liver (L) and kidney (K) tissues using antibodies against arginase I and II, iNOS and α-tubulin. (A) representative samples of SDS – PAGE. (B) Densitometric quantification of the protein bands. Given are arbitrary units of the optical density of the respective bands, means+s.e.mean of n=6 – 11 for arginases and n=3 for iNOS. *P<0.05; **P<0.01 compared with the respective control value (absence of LPS and IFN-γ).