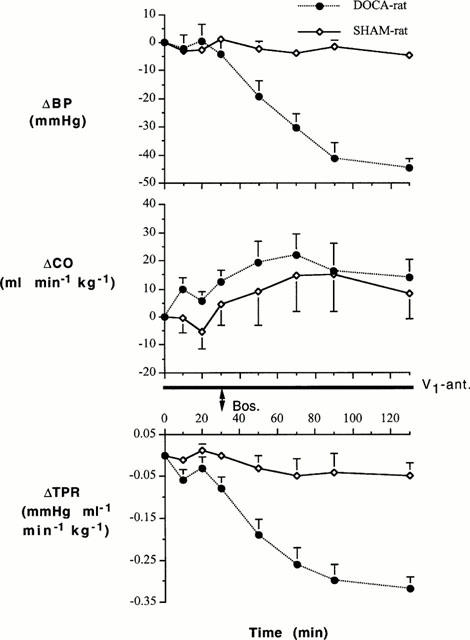
Figure 1.

Changes in BP, CO and TPR of DOCA-salt hypertensive and SHAM control rats following treatment with the V1 receptor antagonist (V1-ant.) and then bosentan (Bos). After a 2 h control period, 8 μg kg−1 of the V1 receptor antagonist was injected followed by 0.05 μg kg−1 min−1 for the remainder of the experiment. Thirty minutes after the start of the V1 antagonist, a bolus dose of bosentan (30 mg kg−1) was injected through another venous catheter and the responses to bosentan were followed for another 100 min. Group-Time Interactions (ANOVA for repeated measures): 0 – 30 min – BP (F=1.213, df=3, P=0.318), CO (F=1.271, df=3, P=0.298), TPR (F=2.310, df=3, P=0.091); 30 – 130 min – BP (F=20.767, df=4, P<0.001), CO (F=0.241, df=4, P=0.914), TPR (F=7.998, df=4, P<0.001).
