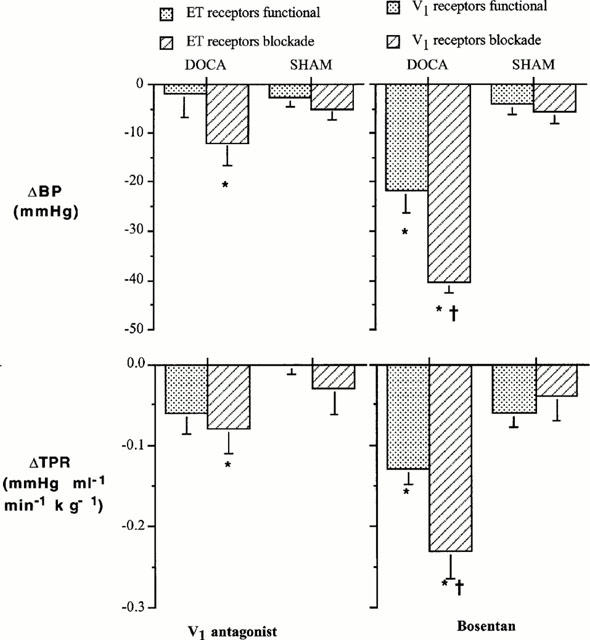
Figure 3.

Changes in BP and TPR to the V1 receptor antagonist and bosentan in DOCA-salt hypertensive rats (DOCA) and SHAM control rats (SHAM). *P<0.05 compared to the antagonist pretreatment value and †P<0.05 compared to response when V1 receptors were functional.
