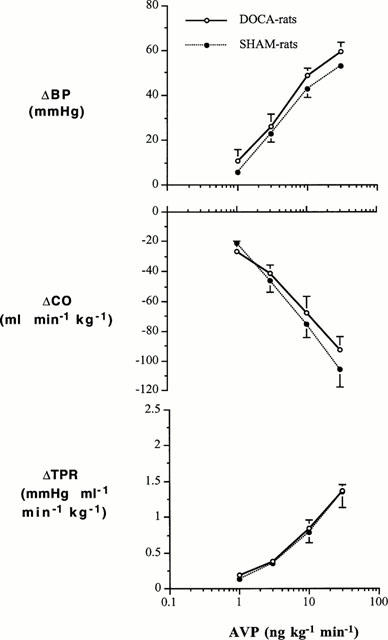
Figure 5.

Changes in BP, CO and TPR to cumulative i.v. infusions of AVP in DOCA-salt hypertensive rats and SHAM control rats. Group-Dose Interactions (ANOVA for repeated measures): BP (F=0.099, df=3, P=0.959), CO (F=1.154, df=3, P=0.348), and TPR (F=0.0898, df=3, P=0.965).
