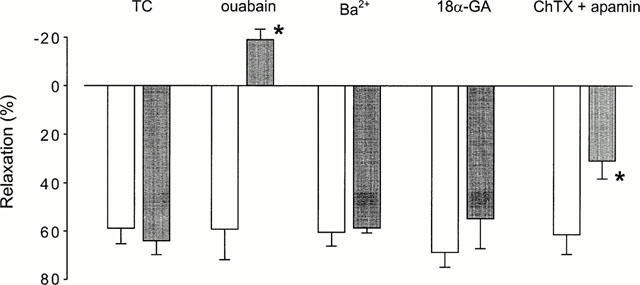
Figure 4.

Effects of ouabain (10 μM), Ba2+ (50 μM), 18α-glycyrrhetinic acid (18α-GA, 50 μM) and charybdotoxin (ChTX, 100 nM) plus apamin (1 μM) on relaxations induced by 10 mM K+ in L-NAME-pretreated tissues. Open bars are control responses and closed bars are time control (TC) or drug-treated responses. Relaxations are expressed as percentages of 1 μM phenylephrine-induced precontractions, while the negative value means a contraction response. Data are mean±s.e.mean. *P<0.05, one-way ANOVA followed by Student's t-test, n=4 – 6.
