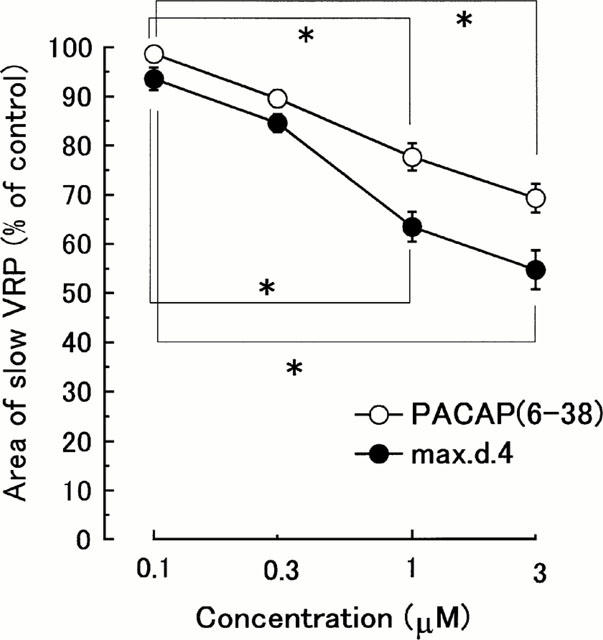
Figure 2.

Concentration-inhibition curves showing the effects of max.d.4 and PACAP(6-38) on the slow VRP. Ordinate scale: integrated area of slow VRP expressed as a percentage of the averaged three consecutive control responses just before the drug application. Abscissa scale: logarithmic concentration of max.d.4 and PACAP(6-38). Each point and vertical bar represent mean±s.e.mean (n=5) *P<0.05.
