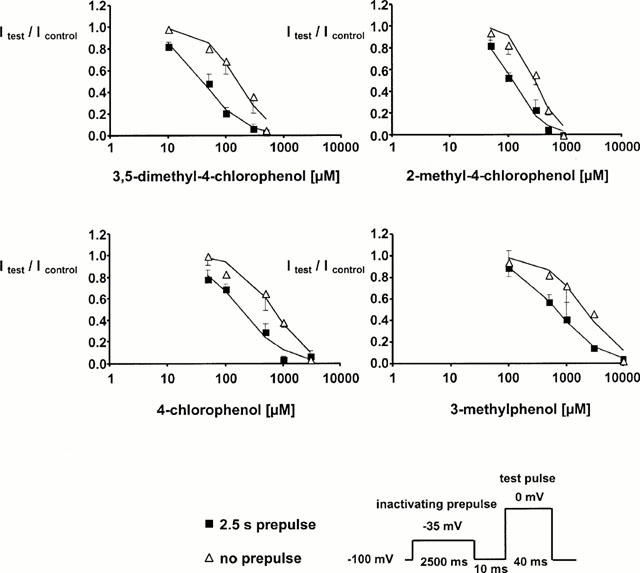
Figure 4.

Concentration-dependent reduction in test pulse current with (filled squares) or without (empty triangles) a 2.5 s inactivating prepulse introduced before the test pulse (n>4, mean±s.d.). Drug concentrations on the x-axes were plotted on a logarithmic scale. Currents were normalized to the current elicited with the same protocol in control conditions. The solid lines are Hill fits to the data. The 2.5 s prepulse uniformly enhanced sensitivity to all compounds examined.
