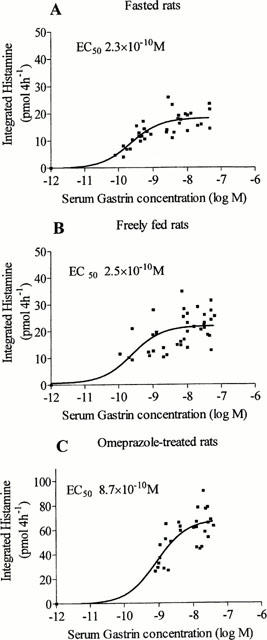
Figure 4.

Gastrin concentration-response curves in hypo- (fasted, A), normo- (freely fed, B) and hypergastrinemic (1-week omeprazole treatment, C) rats. The curves were constructed from the serum gastrin and microdialysate histamine concentrations of the experiments in Figure 3 and from the assumption that no histamine would be released from the ECL cells at a gastrin concentration of 10−12 M. The EC50 values were calculated by identifying the gastrin concentration at the point of intersection of the concentration-response curve with the half-maximal level of histamine release. The EC50 values were 2.3×10⁻¹⁰ M in the fasted rats (95% confidence interval, CI: 1.3×10⁻¹⁰ - 3.0×10⁻¹⁰), 2.5×10⁻¹⁰ M in the freely fed rats (CI: 9.8×10⁻¹¹ - 6.7×10⁻¹⁰) and 8.7×10⁻¹⁰ M in the omeprazole-treated rats (CI: 4.6×10⁻¹⁰ - 1.6×10⁻⁹). The maximal histamine response was 18.4 pmol 4 h−1±0.8, 21.9 pmol 4 h−1±1.2 and 68.0 pmol 4 h−1±3.5 in hypo-, normo- and hypergastrinemic rats, respectively.
