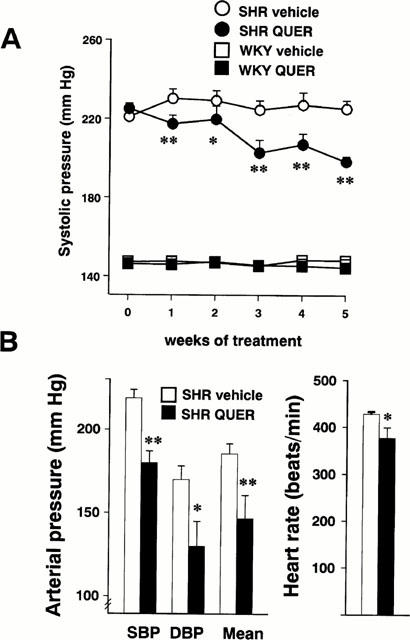
Figure 1.

Effects of quercetin on arterial blood pressure and heart rate. (A) Represents the time course of the systolic arterial pressure as measured by tail-cuff plethysmography in the SHR vehicle (n=10), SHR quercetin (QUER, n=10), WKY vehicle (n=7) and WKY quercetin (n=7) groups. (B) Shows the direct measurements of systolic (SBP), diastolic (DBP) and mean arterial pressure and heart rate in the SHR vehicle (solid bars, n=4) and SHR quercetin (open bars, n= 4) groups. Values are expressed as means±s.e.mean. *P<0.05, **P<0.01 vs the SHR vehicle group (Bonferroni's test).
