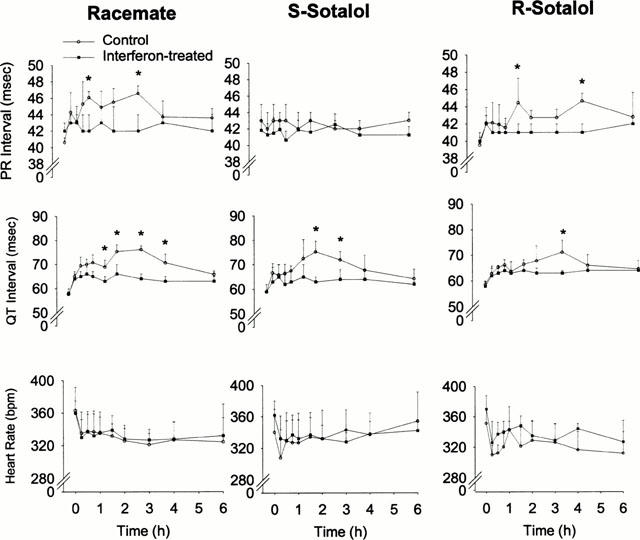
Figure 3.

Time courses of sotalol effect following administration of single oral doses of 40 mg kg−1 sotalol racemate, S-sotalol (40 mg kg−1) and R-sotalol (20 mg kg−1) to control and interferonα 2a (IFN)α2a treated rats. Error bars represent standard deviation of the mean (n=6 per group); *Denotes significantly different (P<0.05).
