
Figure 4.
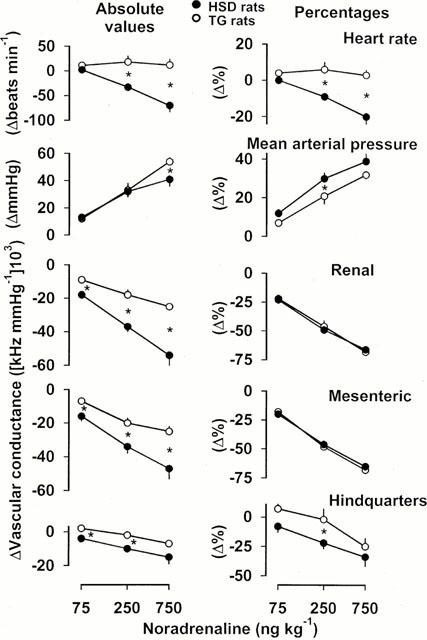
Cardiovascular changes (absolute values and percentages) in HSD rats (n=10) and TG rats (n=10) in response to noradrenaline in increasing bolus i.v. doses. For clarity, the statistics relating to the effects of these interventions are given in the text, and only the between-strain differences are indicated. Values are mean, and vertical bars show s.e.mean; *P<0.05 for change in HSD rats vs TG rats (Mann – Whitney U-test).