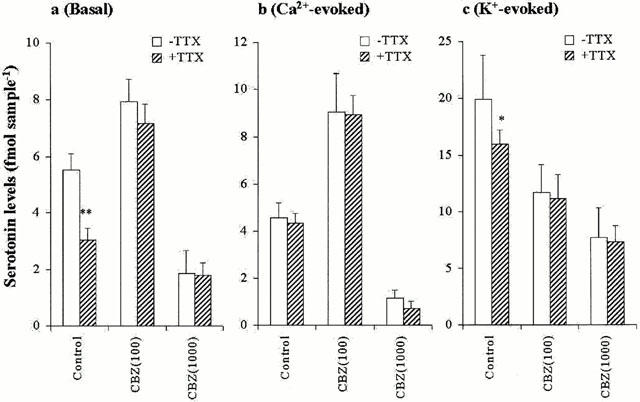
Figure 7.

Interaction between Na+ channel antagonist and carbamazepine on serotonin release. The interaction between 0.1 μM TTX, 100 and 1000 μM CBZ on basal, Ca2+- and K+-evoked hippocampal serotonin releases are represented in a, b and c, respectively. The ordinates indicate the mean±s.d. (n=6) of serotonin release level (fmol sample−1). The data was analysed by two-way ANOVA with Tukey's multiple comparison (*: P<0.05; **: P<0.01).
