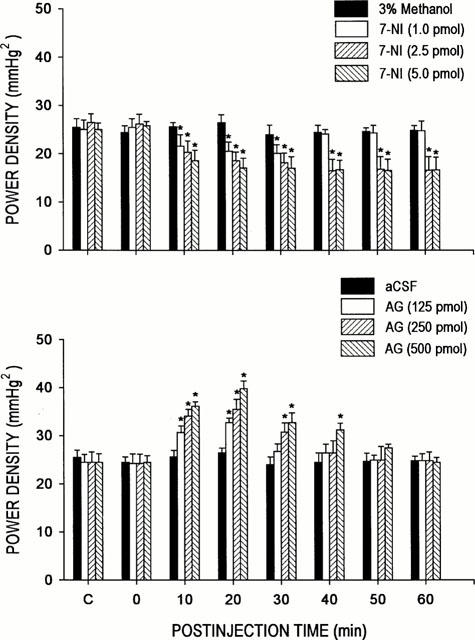
Figure 3.

Time-course changes in total power density of the vasomotor components (0–0.8 Hz) in the systemic arterial pressure spectrum from rats that received microinjection bilaterally into the RVLM of 3% methanol or 7-NI (upper panel), or aCSF or AG (lower panel). Values are mean±s.e.mean, n=6–7 animals per experimental group. *P<0.05 vs 3% methanol or aCSF group at corresponding time-points in the Scheffé multiple-range test.
