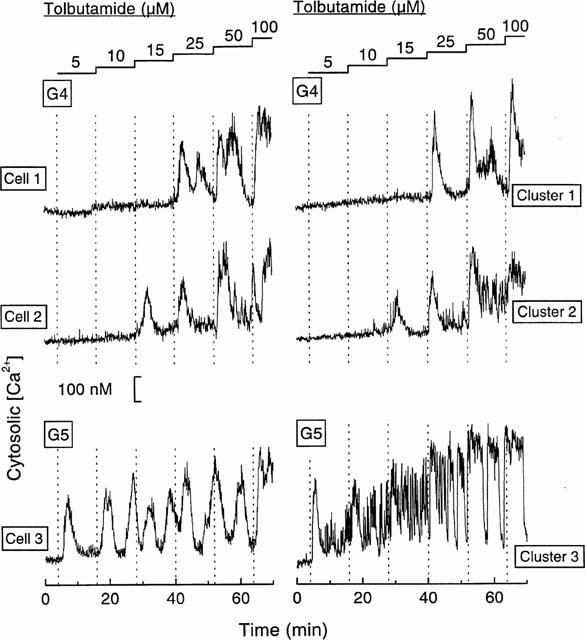
Figure 1.

Examples of [Ca2+]i responses to increasing tolbutamide concentrations in islet single cells or clusters perifused with 4 or 5 mM glucose (G). Each tolbutamide concentration was applied for 12 min except 100 μM (6 min). Cells 1 and 2, and clusters 1 and 2 showed different sensitivities to tolbutamide in the presence of 4 mM glucose. Cell 3 and cluster 3 already responded to 5 μM tolbutamide in 5 mM glucose. The quantification of these different responses is presented in Figures 2 and 3.
