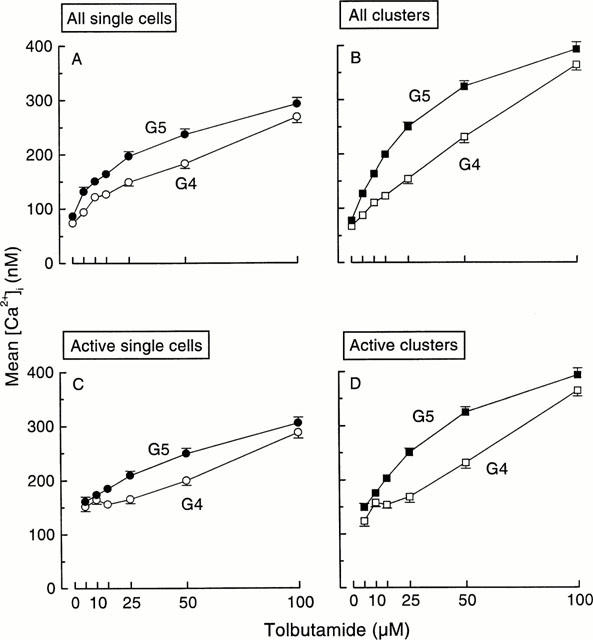
Figure 3.

Influence of the tolbutamide concentration on average [Ca2+]i in islet single cells and clusters. At each tolbutamide concentration, mean [Ca2+]i was calculated for each cell and cluster even when there was no elevation of [Ca2+]i. (A and B) show the results for all, active and inactive, single cells and clusters. The observed increase in [Ca2+]i thus reflects both the recruitment of cells and clusters and the increase in the individual responses. (C and D) only consider those single cells and clusters showing a [Ca2+]i rise above basal values. The n values thus increase with the tolbutamide concentration. These curves therefore illustrate the increase in the amplitude of the individual responses.
