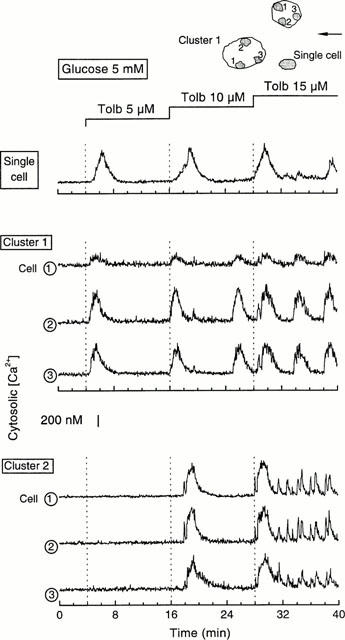
Figure 4.

Synchrony of tolbutamide-induced [Ca2+]i changes within clusters and asynchrony of the signals between clusters and single cells. On top of the figure are drawn the two clusters comprising 14 cells (cluster 1) and seven cells (cluster 2), and the single cell that were studied simultaneously. The arrow indicates the direction of the perifusion flow. In each cluster, the signal was analysed on three regions marked 1–3. The concentration of tolbutamide was increased stepwise in the presence of 5 mM glucose.
