Figure 4.

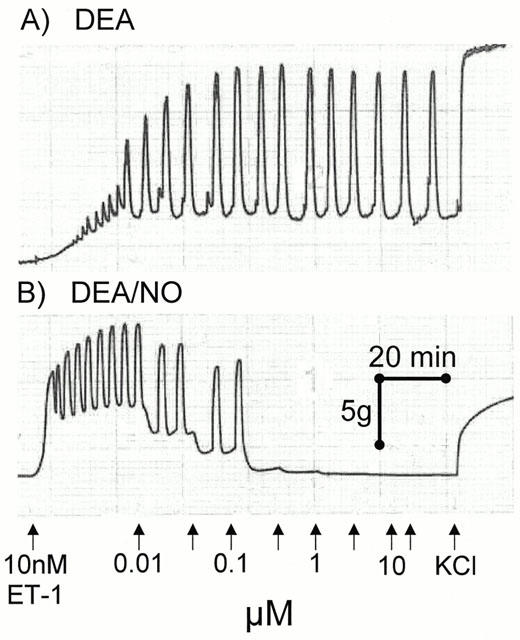
Original trace recording showing concentration-response curves to DEA/NO and the inactive breakdown product DEA in sections of human conductance coronary artery. The phasic contractions seen are spontaneous activity of the tissue.

Original trace recording showing concentration-response curves to DEA/NO and the inactive breakdown product DEA in sections of human conductance coronary artery. The phasic contractions seen are spontaneous activity of the tissue.