
Figure 3.
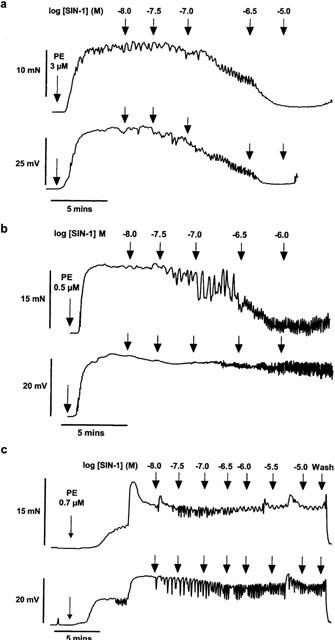
(a) Representative traces illustrating simultaneous changes in tension (mN) and membrane potential (mV) to cumulative additions of SIN-1 (0.01–10 μM) in an endothelium-intact arterial segment. (b) Representative traces illustrating simultaneous recordings of changes in tension and membrane potential to cumulative additions of SIN-1 (0.01–10 μM) in an endothelium-denuded arterial segment in the presence of ChTX alone and (c) in combination with ODQ.