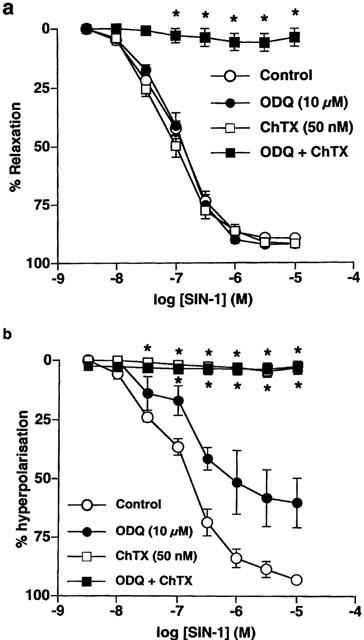
Figure 4.

Mean concentration-response curves for SIN-1-evoked relaxation (a) and hyperpolarization (b) in endothelium-denuded arteries in the absence and presence of ODQ (10 μM) and ChTX (50 nM) alone and in combination. All points are the mean of 4–5 observations with s.e.means shown by vertical lines. *P<0.01 compared to control values.
