
Figure 2.
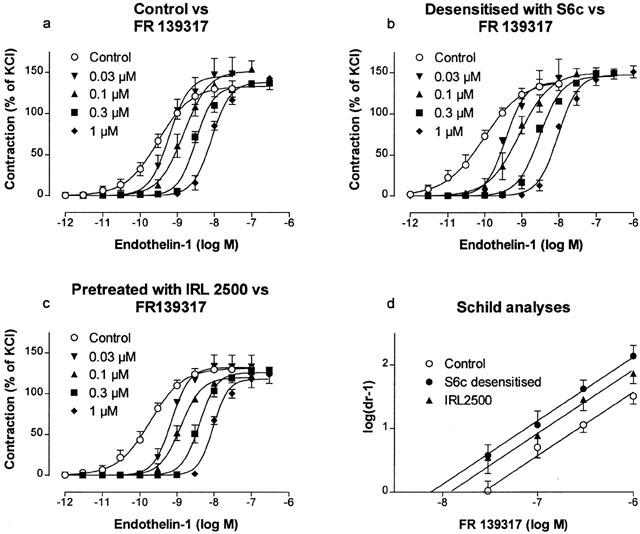
Concentration-effect curves obtained on rat small mesenteric artery segments to ET-1 in the absence and presence of 0.03, 0.1, 0.3 and 1 μM FR 139317 – control (a), pre-treated with 0.3 μM S6c (b) and pre-treated with 1 μM IRL 2500 (c). Contractions are expressed as a percentage of the response to 60 mM KCl. Corresponding Schild plots are shown in panel (d). Each point represents the mean of all segments tested with error bars representing s.e.mean from 5 – 10 animals.