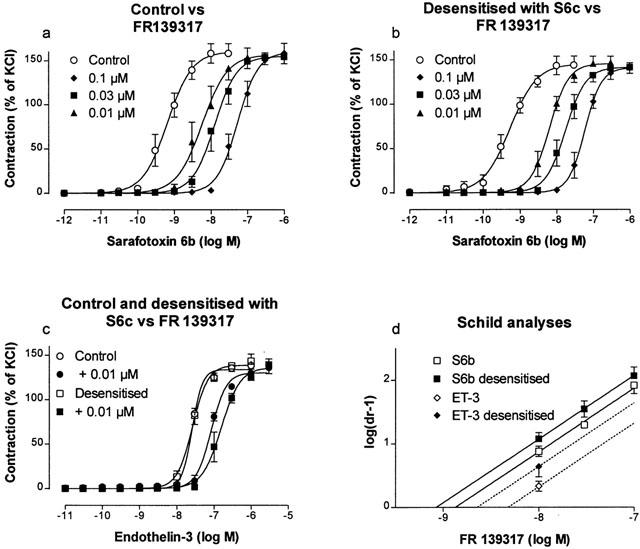
Figure 3.

Concentration-effect curves obtained on rat small mesenteric artery segments to S6b in the absence and presence of 0.01, 0.03 and 0.1 μM FR 139317 – control (a), pre-treated with 0.3 μM S6c (b). Concentration-effect curves to ET-3 (c) in the absence and presence of 0.01 μM FR 139317 for controls and in the absence and presence of 0.01 μM FR 139317 in arteries pre-treated with 0.3 μM S6c. Contractions are expressed as a percentage of the response to 60 mM KCl. Corresponding Schild plots are shown in panel (d). The hatched line shows the extrapolated Schild plot for the interaction between ET-3 and the single concentration of FR139317 investigated. Each point represents the mean of all segments tested with error bars representing s.e.mean from five animals.
