
Figure 4.
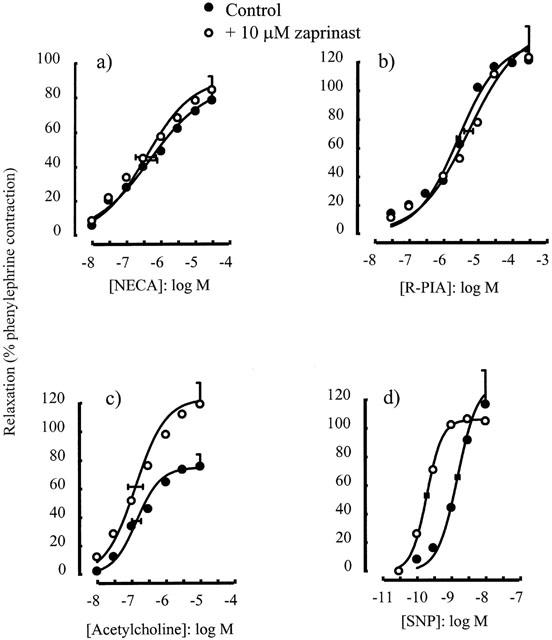
Relaxations of the rat isolated thoracic aorta induced by (a) NECA, (b) R-PIA, (c) acetylcholine and (d) SNP alone or in the presence of zaprinast (10 μM). Data points are mean responses (per cent relaxation of contraction induced by 0.1 μM phenylephrine) and the curves through the data were generated by use of logistic fitting parameters. Average p[A]50 and α values are marked, together with their associated s.e.mean (n=4 – 7). For abbreviations see text.