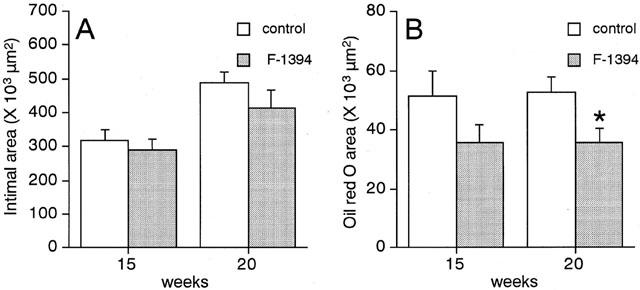
Figure 2.

Quantitative analysis of the extent of neointima (A) and oil red O-positive area (B) in the aortic sinus from apoE/LDLr-DKO mice. Each column is the mean±s.e.mean of results from 13–14 mice. Statistical analysis was performed by Student's t-test. *P<0.05 vs corresponding control.
