
Figure 4.
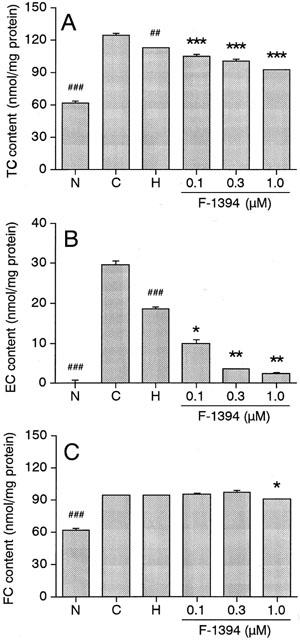
Effect of F-1394 on accumulation of TC (A), EC (B), and FC (C) in mouse peritoneal macrophages. Left columns: N, normal macrophages; C, control macrophages (foam cells); H, HDL-treated control macrophages; right columns; F-1394- and HDL-treated control macrophages. Each column is the mean±s.e.mean of results from triplicate assays. Statistical analysis was performed by Student's t-test or Aspin–Welch's test. ##P<0.01; ###P<0.001 vs control macrophages (C). *P<0.05, **P<0.01, ***P<0.001 vs HDL-treated control macrophages (H).