
Figure 2.
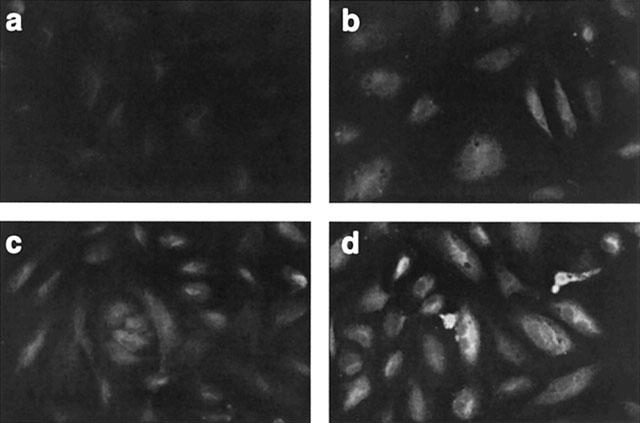
Immunofluorescence analyses of COX-2 in HUVEC exposed to SIN-1 and/or IL-1α. Cells were treated as described in the legend of Figure 1 and further processed as described in the Methods section. (a) Unstimulated cells, (b) 1 mM SIN-1, (c) 25 u ml−1 IL-1α, (d) 1 mM SIN-1+25 u ml−1 IL-1α. Magnification×250.