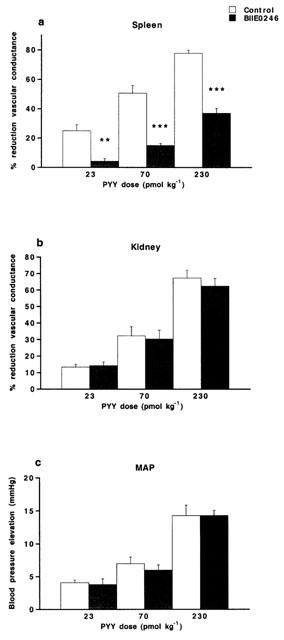
Figure 3.

Vasoconstrictor responses (expressed as per cent reduction of vascular conductance compared to basal) evoked in (a) spleen and (b) kidney and (c) elevation of MAP (in mmHg) upon i.v. injected PYY (23–230 pmol kg−1) in the anaesthetized pig. The vascular responses are shown before (control) and after treatment with the NPY Y2 receptor antagonist BIIE0246 (100 nmol kg−1, i.v.). Data are given as means±s.e.mean, n=6–9. Significant differences compared to control are indicated **P<0.01, ***P<0.001.
