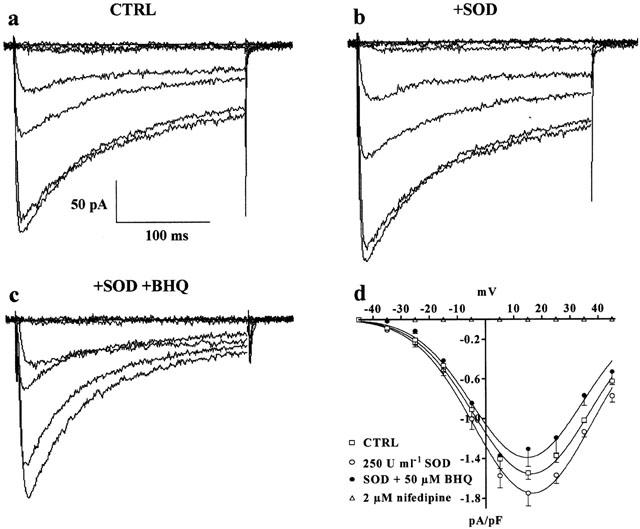
Figure 4.

Effect of SOD on BHQ-induced inhibition of ICa(L). (a–c) Representative recordings illustrating whole-cell ICa(L). The current traces, elicited with 250 ms depolarizing voltage-clamp pulses from Vh of −50 mV to test potentials of −75 to 45 mV in increments of 20 mV, were recorded in the absence (CTRL) (a) or presence of 250 u ml−1 SOD (b) and SOD plus 50 μM BHQ (c). (d) Current–voltage relationships obtained in the absence (CTRL) or presence of SOD and SOD plus BHQ. ICa(L) suppression by 2 μM nifedipine is also shown. Data points are means±s.e.mean of four cells (n=3).
