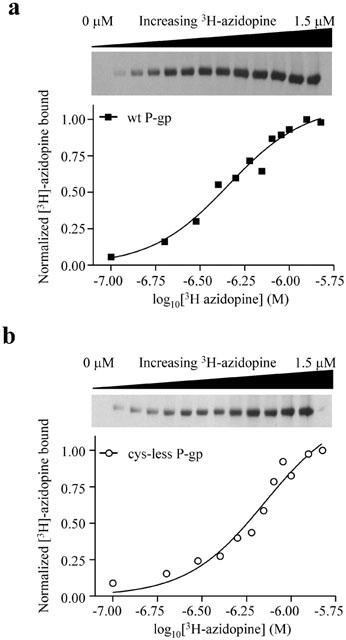
Figure 2.

Photoaffinity labelling of purified and reconstituted wild-type (a) and cys-less P-gp (b) with increasing concentrations of [3H]-azidopine. Following removal of free [3H]-azidopine by 7.5% SDS – PAGE, bound material was visualized by autoradiography (upper panels). The amount of [3H]-azidopine bound was quantified using NIH 2.0 Image software and normalized to maximal observed binding (lower panels). KD values were determined from non-linear regression analysis of the general dose-response equation.
