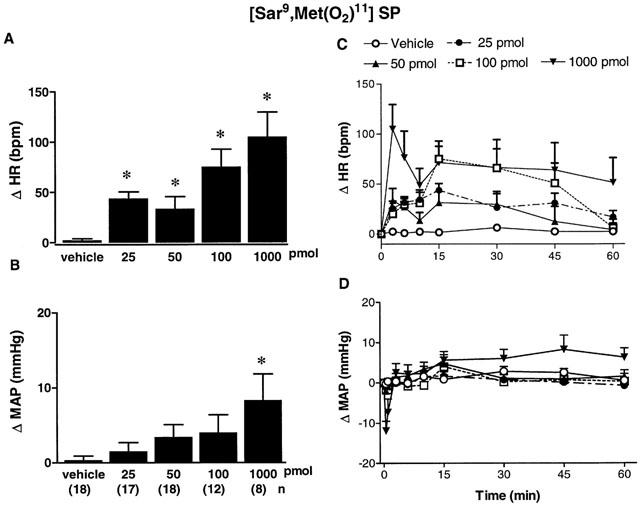
Figure 2.

Maximal changes (A,B) and time-course effects (C,D) on heart rate (Δ HR, A,C) and mean arterial pressure (Δ MAP, B,D) following bilateral SN microinjection of vehicle (aCSF) or increasing doses of the NK1 agonist [Sar9,Met(O2)11]SP from 25 pmol to 1 nmol in conscious rats. Each point represents the mean±s.e.mean of (n) rats. Comparison to vehicle values is indicated by *P<0.05 (one-way ANOVA followed by a test of Bonferroni). Basal values were: MAP: 105±8 mmHg and HR:347±12 b.p.m.
