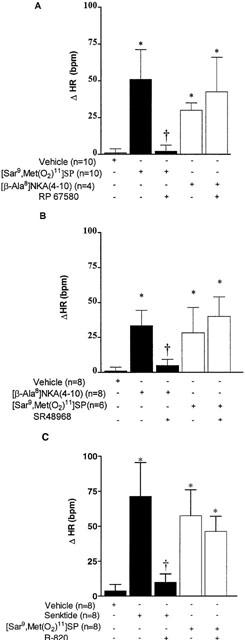
Figure 6.

Bar graphs showing maximum heart rate responses (ΔHR) following bilateral SN microinjection of [Sar9,Met(O2)11]SP (25 pmol in A and B or 50 pmol in C), [β-Ala8]NKA (4 – 10) (25 pmol) and senktide (50 pmol) in the absence (−) and presence (+) of (A) RP67580 (250 pmol), (B) SR 48968 (250 pmol) and (C) R-820 (500 pmol) in conscious rats. Each point represents the mean±s.e.mean of (n) rats. Statistical comparison was made to vehicle values (*P<0.05) or to the agonist alone (†P<0.05), using one-way ANOVA followed by a test of Bonferroni.
