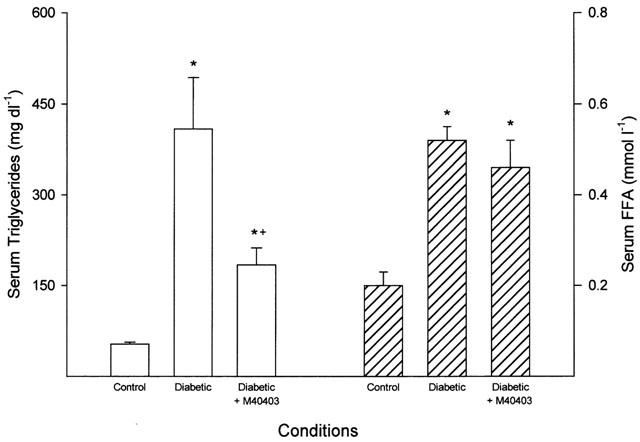
Figure 1.

Serum triglyceride and free fatty acid levels. Data are presented as the mean±s.e.mean for 17 control rats, 14 untreated diabetic rats and 11 diabetic rats treated with M40403. The * denotes a significant difference compared to control, P<0.05. The+denotes a significant difference compared to untreated diabetic rats, P<0.05.
