
Figure 1.
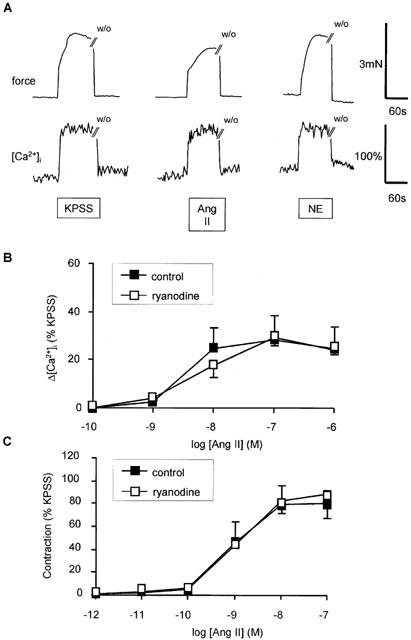
Effect of angiotensin II (AII) on intracellular Ca2+ and force production by human subcutaneous resistance arteries. (A) Traces showing effect of by KPSS, 100 nM angiotensin II, 10 μM NE on force (upper trace) and [Ca2+]i. Exposure to drugs is indicated by the bar and time of washout (w/o) is shown. (B) Concentration response relationship for peak increase in [Ca2+]i (Δ[Ca2+]i) in response to angiotensin II in the presence or absence of ryanodine (10 μM). Data represent mean±s.e.mean of per cent response to KPSS (n=4). (C) Concentration response relationship for contraction in response to angiotensin II in the presence or absence of ryanodine (10 μM). Data represent mean±s.e.mean of per cent response to KPSS (n=4).