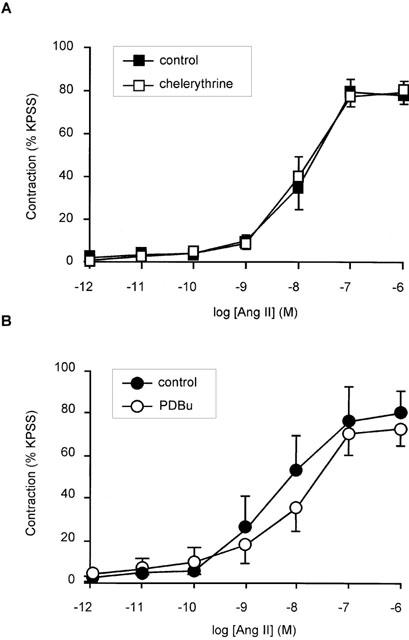
Figure 5.

Effect of PKC inhibition with chelerythrine and PKC down-regulation with PDBu on angiotensin II-induced contraction in human subcutaneous resistance arteries. (A) Concentration response relationship for contraction in response to angiotensin II in the presence and absence of 1 μM chelerythrine). Points represent mean±s.e.mean of per cent response to KPSS (n=5). (B) Concentration response relationship between angiotensin II and contraction (expressed as per cent response to KPSS) in vessels treated overnight with 500 nM PDBu or with 500 nM 4αPDD (inactive control). Points represent mean±s.e.mean of per cent response to KPSS (n=5).
