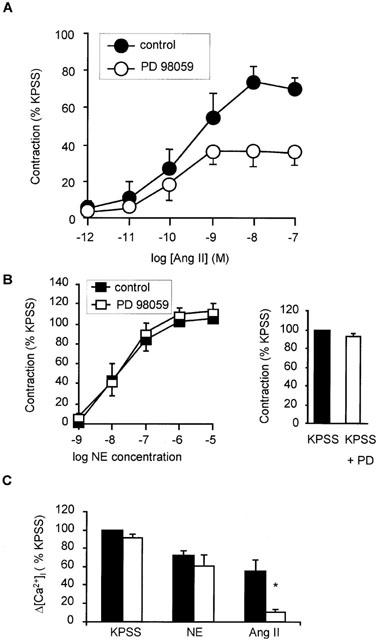
Figure 8.

Effect of MEK inhibitor PD98059 on angiotensin II-induced contraction and peak increase in [Ca2+]i in response to angiotensin II, NE and KPSS. (A) Effect of PD98059 (30 μM; 10 min) on concentration response relationship for contraction in response to angiotensin II (n=5). (B) Effect of PD98059 (30 μM; 10 min) on concentration-response relationship for contraction in response to NE (n=5). Inset is bar graph showing effect of PD98059 (30 μM; 10 min) on contraction in response to KPSS. Bars represent mean±s.e.mean of five observations. (C) Comparison of peak increase in [Ca2+]i (Δ[Ca2+]i) in response to 100 nM angiotensin II, 10 μM NE and KPSS in the absence and presence of 30 μM PD98059 (n=3 for all). Bars represent mean±s.e.mean of per cent peak response to 118 mM K. *Indicates P<0.05.
