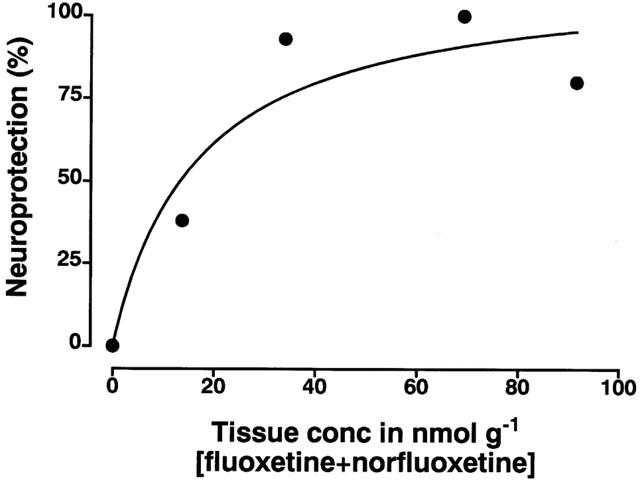
Figure 7.

Plot of the mean concentration of fluoxetine plus norfluoxetine in cortical tissue at various times post fluoxetine injection (taken from data presented in Figure 4) and the degree of neuroprotection measured as the per cent of loss of cortical tissue 5-HT seen following fluoxetine administration to MDMA-treated rats versus the loss seen following MDMA alone.
