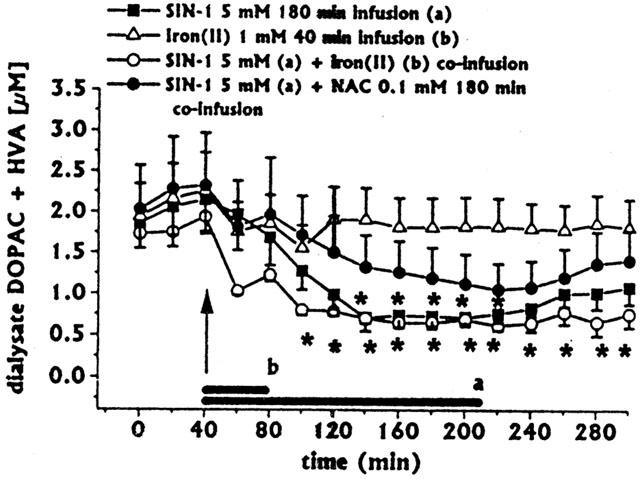
Figure 2.

Effect of intrastriatal infusion of SIN-1 (n=4) or iron (II) (n=3) on DOPAC+HVA dialysate concentrations, and effects of iron (II) (n=4) or NAC+iron (II) (n=3) co-infusion with SIN-1, on SIN-1-induced changes in DOPAC+HVA concentrations. Dialysates were collected, at 20 min intervals, for 180 min during drug infusion (horizontal black bars) and for 80 min after discontinuation of drug infusion. Values are given as mean±s.e.mean. *P<0.05 compared with baseline values.
