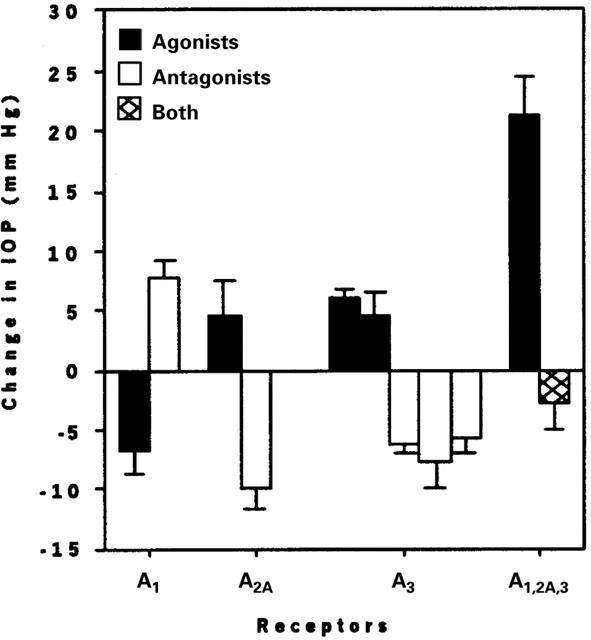
Figure 1.

Means±s.e.mean of the responses to minimally effective concentrations of AR agonists and antagonists: 100 nM CPA, 100 nM DCPCX, 60 μM CGS 21680, 100 nM ZM241385, 200 nM Cl-IB-MECA, 140 nM IB-MECA, 25 μM MRS 1191, 11 μM MRS 1097, and 400 μM MRS 1523. At the extreme right of the bar graph, data are presented for 100 μM adenosine with and without pretreatment with the A3 AR antagonist MRS 1191.
