
Figure 6.
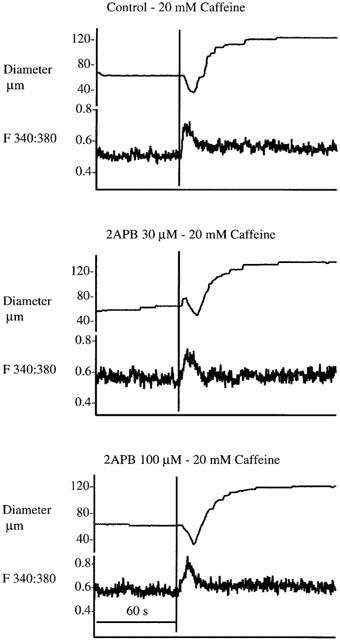
Data illustrating a lack of effect of 2APB (30 and 100 μM). Example responses typical of three separate experiments are shown. Tracings illustrate arteriole diameter responses and associated changes in [Ca2+]i following exposure to caffeine (20 mM) in the absence and presence of 2APB.