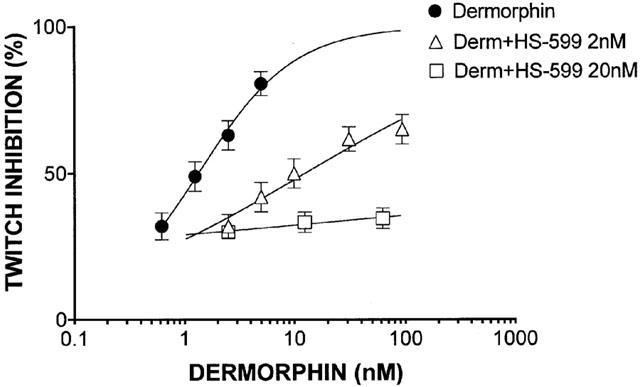
Figure 3.

Guinea-pig ileum preparation. Log-concentration-response curves for the μ-opioid receptor selective agonist dermorphin, alone or in the presence of different concentrations of HS-599. Dermorphin, slope=1.002 [0.8123 – 1.092]; dermorphin+HS-599 2 nM, slope=0.3838 [0.2888 – 0.4788], P<0.01; dermorphin+HS-599 20 nM, slope=0.06562 [−0.1417 – 0.1454], P<0.01 (Nonlinear regression analysis, Prism).
