
Figure 4.
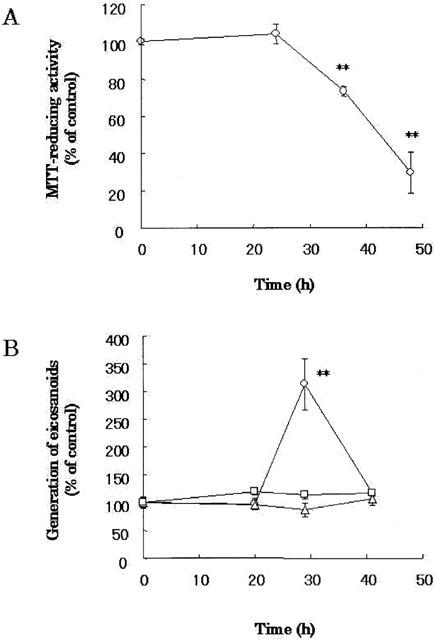
Aβ(25 – 35)-induced neuronal cell death and generation of eicosanoids from Neurons. Cortical neurons were treated with 10 μM Aβ(25 – 35). MTT-reducing activity (A) and eicosanoids (B) were measured at the indicated time points after Aβ treatment. PGD2 (circles), PG E2 (triangles) and LBT4 (squares) were measured with their RIA kits. The control level of PGD2, PGE2 or LTB4 was 73±3, 198±20 or 752±38 pg/ml, respectively. Data are expressed as mean±s.e.mean values (n=4). **P<0.01, compared with vehicle control by ANOVA followed by Dunnett's test. Vehicle control is treated with culture medium containing 1% deionized water and 0.1% DMSO.