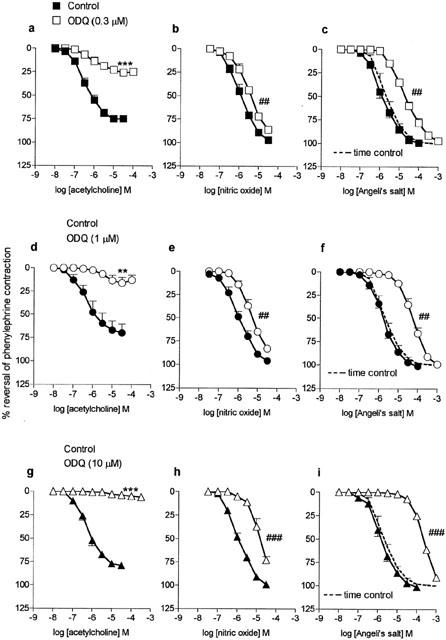
Figure 1.

Mean concentration-response curves to acetylcholine (a, d and g; n=4 – 7), nitric oxide gas solution (b, e and h; n=4) and Angeli's salt, (c, f and i; n=4) on mouse aortae pre-contracted with phenylephrine in the absence (control; closed symbols) and then in the presence (open symbols) of ODQ (0.3 μM, a, b and c; 1 μM, d, e and f; 10 μM, g, h and i; pre-incubation 30 min). The broken line represents the time control values for Angeli's salt (i.e second curve in the absence of ODQ; n=4). Relaxation responses are expressed as per cent reversal of the phenylephrine-induced contraction. Points are mean values with s.e.mean shown by vertical bars except when smaller than the size of the symbols. **0.01>P>0.001, ***P<0.001 Response significantly less than corresponding response in the absence of ODQ. ## 0.01>P>0.001, ### P<0.001 Significant parallel shift in curve based on a decrease in negative log IC50 (see ‘log unit shifts' in Table 1).
