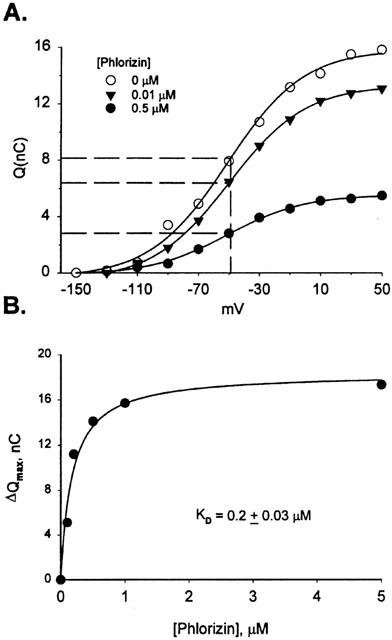
Figure 5.

Charge/voltage relationship for phlorizin and kinetic analysis of ΔQmax. (A) The charge (Q) moved for 0, 0.1 and 0.5 μM phlorizin is plotted for each voltage. The dotted line corresponds to 0.5 Qmax for each curve, showing that V0.5 did not change with increasing concentration of phlorizin. (B) ΔQmax is plotted against [phlorizin], and the data was fit to equation [1], indicating a KD of 0.2±0.03 μM.
