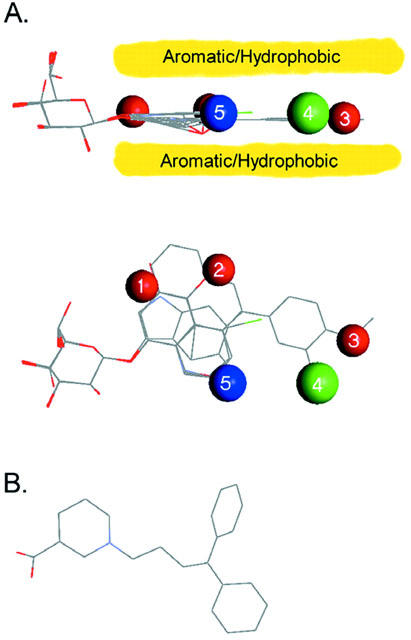
Figure 6.

Pharmacophore for inhibiton of hSGLT1. Seven structures, representative of the range of shapes and potentially interacting groups are overlaid, and regions and types of interactions from the surrounding protein are designated. (Salicin, arbutin, two conformations of 2-NaphGal, 1-NaphGal, rhapontin, and 5-Br-6-Cl.) Red spheres are areas which have the capacity to donate and accept H-bonds from the glycoside; the blue sphere is a location where only a donation to the glycoside is allowed; green signifies a position where H-bonding is not favourable; and the yellow region shows the extent of a planar region of aromatic or hydrophobic interaction. Interactions for the sugar are not shown. (A) Side view, showing the planar structure of the inhibitors and its alignment with the pyranose ring. The yellow bands indicate the aromatic/hydrophobic interaction with the protein. (B) Top view of the pharmacophore, showing location of predicted hydrogen bonding interactions. (C) Structure of the GAT1 pharmacophore, adapted from N'goka et al. (1991) showing similarities in size and structure of the SGLT1 and GAT1 pharmacophores.
